Nonprofit KPIs: 8 measurements that actually change decisions


Nonprofit KPIs only matter if they change a decision. Track a small set well, share them with the people who act on them and update them at a cadence your team can sustain. Here are the eight that consistently earn their place.
Most nonprofits I've worked with don't have a KPI problem. Instead, they have a dashboard problem. The data is there, scattered across a donation plugin, a CRM, an email tool, a spreadsheet and a board pack. Each individually answers a question, but none of them together answers "is the organization working?"
To fix this, you need to narrow your KPIs down to a handful of measurements that genuinely drive behavior. This involves agreeing what each one means and putting them somewhere the people who need them can actually find them. A bigger reporting stack solves none of that.
In this guide, I'll define what a nonprofit KPI is, walk through how to choose the right ones for your organization, cover the eight that work for almost every small or mid-sized nonprofit and show how to share the reports with the audiences that need them: board, donors, staff and the public. At the end, you'll have a much clearer idea of which KPIs your nonprofit should be targeting, and how to do it.
What are nonprofit KPIs?
A key performance indicator is a measurement that tells you whether you're moving toward a stated goal. For a nonprofit, that goal might be financial (fundraise $X this year), operational (retain Y% of donors), programmatic (serve Z beneficiaries) or strategic (grow recurring giving by N%).
The word "key" is the part most organizations get wrong. A KPI is the small set of metrics that actually changes what you do, not every metric you can track. If a number moves and your team doesn't act on it, the number is a vanity metric rather than a KPI.
Good nonprofit KPIs share four qualities:
- Quantifiable. A measurable number, not a vibe. "Donor retention rate" is a KPI. "Donors feel valued" isn't.
- Comparable. Useful against itself over time (this quarter vs last quarter) and against industry benchmarks where they exist.
- Sustainable. Tracked at a cadence the team can keep up with. A weekly KPI that takes two days to calculate is a worse KPI than a monthly one that takes an hour.
- Actionable. If the number moves in the wrong direction, someone on the team can do something about it. KPIs without an owner are dashboards, not management tools.
You can also think of it in terms of SMART objectives. Either way, the point of KPIs is to produce fewer, better decisions - not more reports.
How to choose the right KPIs for your nonprofit
Most nonprofits end up tracking either too many KPIs or the wrong ones. A practical way to pick is to work backward from the decisions the leadership team actually makes each month.
For each KPI you're considering, ask:
- Who will look at this number, and how often? If the answer is "no one regularly", the KPI is decoration.
- What decision changes if the number moves up or down? A specific decision, not "we'd talk about it".
- Can we calculate it without major effort? If pulling the number takes a week of staff time each quarter, the cost outweighs the value.
- Does it sit in the right time horizon? Some KPIs are long-term direction-setters (donor lifetime value, retention rate), others are short-term campaign-level (form conversion rate). Mix the two.
A small organization can run well on 5-8 KPIs total: three or four organization-level numbers reviewed monthly, plus campaign-specific KPIs for whatever's active. A mid-sized nonprofit might add another two or three for specific departments.
Industry benchmarks help you sanity-check whether a number is good or bad in absolute terms, but they're a guide, not a target. A retention rate that's average for the sector might still be terrible for your specific mission and donor base.
The 8 most useful nonprofit KPIs to track
The eight KPIs below apply to almost any nonprofit raising money online, and most can be calculated from data you already have in your donation plugin, email tool and bank statements. I'll cover what each one measures, why it matters and the rough benchmark to compare against.
1. Donor retention rate
The percentage of donors who gave last year and gave again this year. The single most important fundraising KPI for almost every nonprofit, because acquiring a new donor costs many times more than retaining an existing one.
The Fundraising Effectiveness Project tracks the sector-wide average at around 45%, with first-time donor retention typically much lower (in the 20-30% range) and loyal-donor retention much higher (60-70%+).
If your retention rate is below the sector average, you're effectively leaking donors faster than you can acquire them, and growth becomes very expensive. The lever to pull is donor stewardship: better thank-you experience, donor surveys, regular non-ask communication, segmented appeals that reflect what the donor cares about.
2. Donor lifetime value (LTV)
The total amount a typical donor contributes over the full relationship with your organization. LTV ties together retention rate, average gift size and giving frequency into a single number that tells you how much an acquired donor is actually worth.
LTV matters operationally because it sets the ceiling on what you can spend to acquire each donor. If your average donor LTV is $300 and you're spending $250 per acquisition, you're operating on thin margins. If LTV is $1,200 and acquisition is $250, you have room to scale acquisition spending.
Calculate LTV at two levels: organization-wide (one average) and by donor segment (recurring vs one-time, online vs offline, event-acquired vs ad-acquired). The segment view almost always reveals that one channel is dramatically more valuable than the others.
3. Recurring gift percentage
The share of total donations that come from recurring (monthly or quarterly) donors. Recurring revenue is the most predictable income a nonprofit has, and it's the single biggest predictor of organizational stability across multi-year periods.
A high recurring percentage gives the leadership team room to plan beyond the next campaign. A low one means every quarter starts from zero. The benchmark varies widely by organization size and category, but a meaningful and growing percentage matters more than hitting a specific number.
The way to grow recurring giving is to offer it on every donation page, default to the recurring option where appropriate and give existing one-time donors a specific, low-friction prompt to convert. If your donation forms don't make recurring giving the prominent option, that's the place to start.
4. Average gift size
The mean donation amount across all gifts in a period. Useful as a quick health check on whether your appeals are landing with the donors you want and whether your suggested donation amounts are calibrated correctly.
Two things will move this number meaningfully:
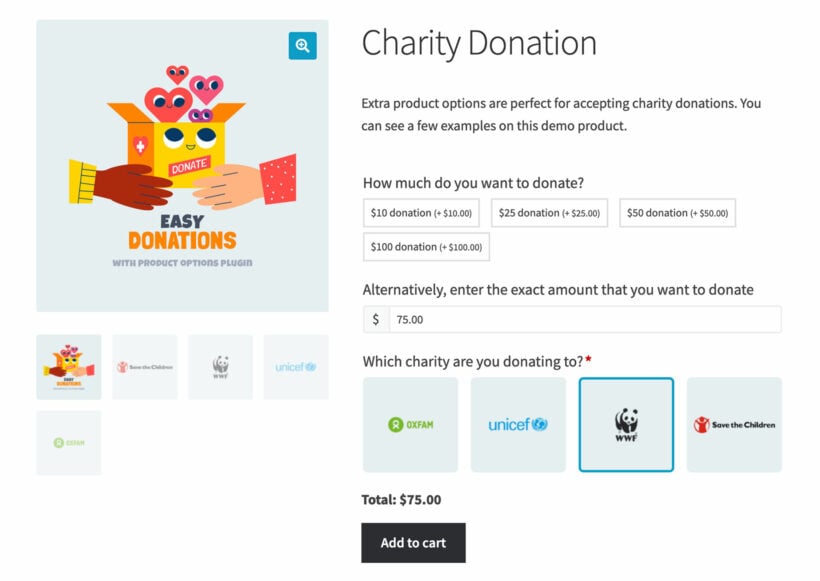
- Suggested amounts on your donation forms. A set of $25, $50 and $100 buttons produces a different average gift than a set of $50, $100 and $250. Test the suggestions on your highest-traffic form first.
- Major-gift work. Even a small number of larger gifts moves the average noticeably. If your organization has the capacity for major-gift outreach, the average is one of the cleanest places to see it pay off.
Average gift size becomes more useful when paired with median gift size, because a small number of very large gifts can hide the actual experience of typical donors.
5. Cost per dollar raised (fundraising ROI)
What it takes you to raise each dollar of donations. Usually expressed as a ratio: $0.20 spent to raise $1.00 is good, $0.50 spent is concerning, $1.00 spent breaks even.
Different fundraising channels, including cheap fundraising ideas, have different cost structures. Direct mail campaigns are typically more expensive per dollar raised than recurring giving from existing donors; events have high gross revenue but often razor-thin net margins after venue, catering and staff time; recurring online giving is usually the cheapest channel.
Tracking cost per dollar raised at the channel level is more useful than the headline organization-wide number. The headline tells you whether you're operating efficiently overall. The channel breakdown tells you where to invest more or cut.
6. New donor acquisition rate
How many new donors join your file in a given period. The growth lever, paired with retention as the retention lever. The two together determine whether your donor base grows, shrinks or holds steady.
New donor acquisition is the most expensive part of fundraising, so this is the KPI most worth pairing with cost per dollar raised. A big jump in new donor acquisition is only good news if the cost per acquired donor is sustainable and if those new donors retain at the same rate as existing ones (they usually don't on the first year).
For organic acquisition, the levers are search visibility, content marketing and partnerships. For paid acquisition, the levers are ad creative, audience targeting and landing-page conversion rate.
7. Donation form conversion rate
The percentage of people who land on a donation form and complete a donation. The single most direct KPI for the on-site fundraising experience, and the one most stores can move significantly with form-level changes.
Three things consistently lift donation form conversion:
- Reducing the number of fields. Every additional field costs you completions. Cut anything not required.
- Offering the payment methods your audience expects. Apple Pay, Google Pay, PayPal and credit card cover most. Add regional methods where the audience needs them.
- Reassurance copy near the submit button. "Your donation is secure" and "We never share your data" reduce hesitation at the critical moment.
If you're moving from GiveWP to a different donation plugin, the conversion rate is the number to track through and after the migration. See my guide to GiveWP alternatives for the donation plugin options to consider and setting up donations in WooCommerce if you're going the WooCommerce route.
8. Program impact metrics
The KPIs that aren't about money. These cover how many beneficiaries you served, how many meals you delivered, how many tutoring hours you provided, how many trees you planted or how many cases you resolved.
Money KPIs tell you whether the engine is running. Impact KPIs tell you whether the engine is going somewhere. Both matter, and most nonprofits I see track the first set obsessively and the second set casually, even though impact metrics are what donors and nonprofit boards of directors actually care about.
The trick with impact metrics is honesty about what you can measure. A direct-service organization can usually count beneficiaries directly. An advocacy organization can't count "policy change", so it tracks proxies such as meetings held, decision-makers reached and coalitions joined. Pick the metric that genuinely correlates with the outcome you're trying to drive, not the one that's easiest to inflate.
Impact metrics also belong in your public-facing reports. Donors who only see fundraising KPIs assume you measure success by how much money you raised. Show them what the money did.
How to share KPI reports with the right audiences
A KPI you can't get in front of the people who need it is a KPI that doesn't change behavior. Most small nonprofits ship their reports as PDF email attachments, which works exactly until someone wants the report from six months ago and can't find which email it was attached to.
A better pattern is a single, organized resource library on your website where each report has a permanent home and an audience-appropriate level of access. Different audiences need different views:
- Board members need detailed quarterly KPI reports, financial statements, the board pack and conflict-of-interest disclosures. Board-only access.
- Major donors and grantmakers want annual impact reports, audited financials and stewardship documents. These are often shared via personal link or donor-portal access rather than fully public.
- The general public gets annual reports, statutory filings (Form 990 in the US, charity accounts in the UK) and high-level impact summaries. Fully public.
- Staff need operational dashboards, policy documents and internal procedures. Staff-only access.

Running four separate document tools (one for each audience) is overkill for almost every nonprofit. The simpler setup is a single document library with category-level access controls, so the same library serves all four audiences and shows each visitor only the documents they're allowed to see.
Document Library Pro handles this on a WordPress site. Each report goes into the library once, tagged with its appropriate category (Board Only, Major Donors, Public, Staff). The plugin shows visitors only the categories their role allows, and a single login lands each user on the version of the library that's relevant to them. For more on how nonprofits are setting this up in practice, see my roundup of WordPress nonprofit resource library examples. If your nonprofit runs on Squarespace, Wix or another non-WordPress platform, the same searchable library of reports is available as a cloud version that works on any website.
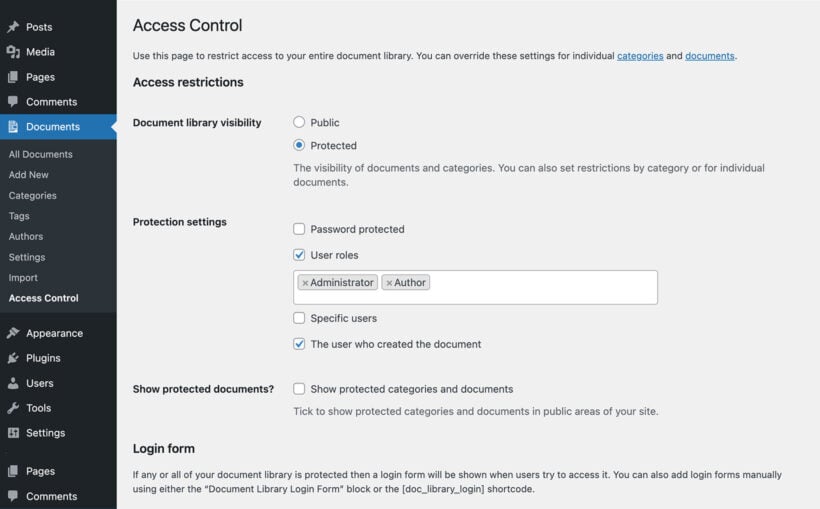
The library also solves the "send me the latest version" problem. When you upload a new quarterly report, the link to the library stays the same and the new report appears in the right category. Board members and donors who bookmarked the library land on the current report automatically, without you having to email anyone a new attachment.
Final thoughts: KPIs are a habit, not a project
The hardest part of running nonprofit KPIs well is maintaining them quarter after quarter without the practice eroding back into "we'll look at it before the next board meeting". Picking which ones to track is the easy part.
Three things make the habit stick:
- One owner per KPI. Each number has a name next to it. That person updates it, presents it and is the one expected to explain a movement in either direction.
- A predictable cadence. Operational KPIs work on a monthly cycle, strategic ones quarterly, long-horizon numbers annually. Same week each month, same agenda item each board meeting.
- A reporting home that doesn't depend on one person's inbox. Whether that's a shared drive, a dashboard tool or a document library on your own site, the reports need to live somewhere both findable and durable.
The nonprofits I've seen do this best treat KPIs as the operational scaffolding that supports every other strategic conversation. The conversation is "should we expand the X program?" The KPI data is what makes the answer something other than a guess.
For more on the wider WordPress setup for nonprofits, see my guides to WordPress for nonprofits, recruiting board members and nonprofit resource library examples.