Woocommerce analytics 101: Follow every customer from first click to sale
On average, 70% of customers drop out after adding a product to the cart. If you don’t know why they vanish, you can’t stop the leak. This article shows you how to see every click that leads (or doesn’t lead) to a sale on your WooCommerce site.
A clear view of the entire customer journey gives you powerful insights into their behavior. You learn exactly where and why they drop off, what keeps them engaged, and which steps lead them to hit the "buy" button.
For anyone using WooCommerce, this level of insight can help make smart decisions that drive growth. However, getting this clear picture of the entire journey isn't always easy with the usual analytics tools.
This article will discuss why WooCommerce tracking leaves you with data gaps, and how to capture full customer journeys, from first visit to the final sale. We will also show you how to enable step-by-step conversion paths and detailed source analytics for your orders. Let’s dig in!
Why are complete WooCommerce analytics essential?
You know the saying, "You can't fix what you can't see." When your analytics are incomplete, you're often left guessing why potential customers leave your site or which marketing efforts are actually bringing in revenue. Complete data changes this. It gives you a clear view of every step in the buying process, making it easy to spot problems and opportunities right away. Here's how seeing the full picture helps your store grow:
- Identify problems quickly: Incomplete data can hide the real roadblocks your customers face.
- Prevent cart abandonment: Cart abandonment is a big challenge for any store. Detailed analytics show you the exact point at which customers give up on their cart.
- Optimize user journeys: Just seeing which pages someone visited doesn't tell the whole story. Tracking their path reveals which sequences of clicks actually lead to conversions or which cause them to leave.
- Maximize marketing ROI: Not all website traffic is equally valuable. When you connect each sale back to where the customer came from, you know which ad campaigns, social media posts, or email newsletters are truly driving revenue.
WooCommerce analytics: what are your options?
There aren’t that many options, but if you’re using the defaults, here are the common analytics options you'll encounter when looking for your analytics data:
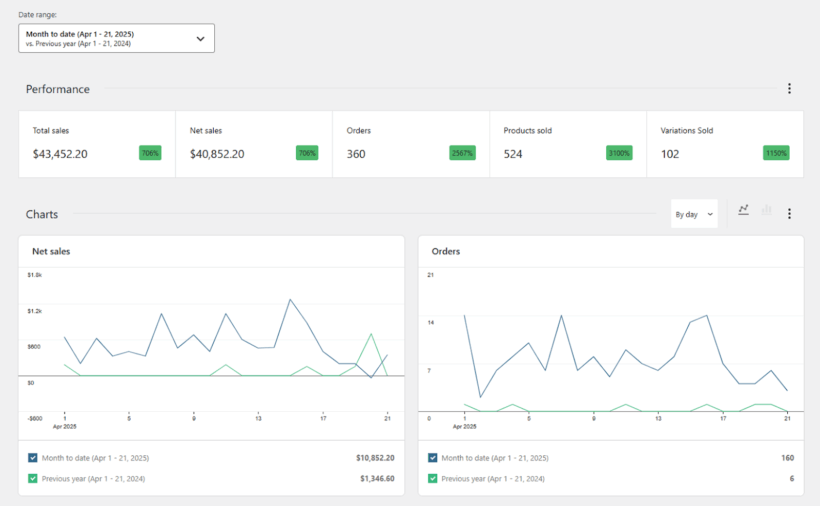
WooCommerce's built-in reports
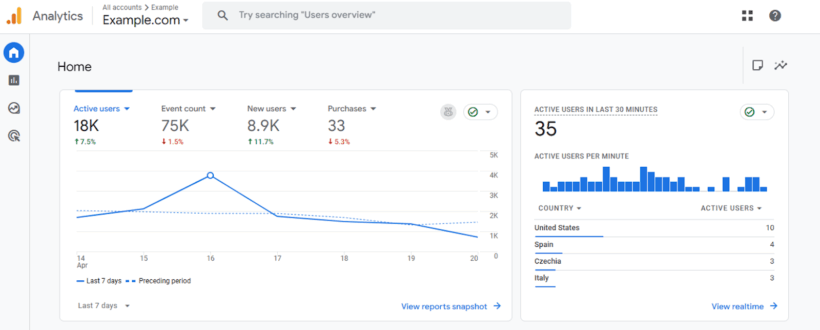
Google Analytics 4 (GA4)
How traditional analytics falls short for journey tracking
While the tools we just discussed enable you to see some analytics, they don't make it straightforward to see that complete, clear picture of the customer journey in your store. They give you numbers and data tables, totals, but don’t show how users actually flow from one page to the next. They often lack intuitive, map-style journey views that would let you quickly see common navigation paths and spot where people drop off at a glance. For example, you might want to see how visitors from your latest email campaign navigated your site and which steps led to purchases. With GA4, it’s possible to create a custom report that gives you a specific, linked customer journey. But good luck figuring out how to set up that report. On top of this, things like ad blockers prevent tracking scripts from loading on certain browsers. This, along with increasing privacy regulations that limit third-party cookies, can lead to fragmented sessions and incomplete data. This means you miss insights from some visitors, making it even harder to piece together a truly reliable full customer journey.
What a full journey looks like
Let’s take a quick look at an example of what a full customer journey through your website would look like:
- You set up an ad for a hoodie in Instagram.
- Jan 1, 8:03pm: Jane clicks the call to action button in your Instagram ad from her phone.
- Jan 1, 8:03pm: Jane spends 90s looking at the product page for the hoodie from your Instagram ad.Jan 1, 8:05pm: Jane looks at
- the related products section on this page, and clicks on a slightly different hoodie and looks at it for 30s.
- Jan 1, 8:06pm: Jane again looks at the related products section on this new page, and clicks on a pair of shoes and looks at it for 10s.
- Jan 1, 8:06pm: Jane goes to the main menu pulldown and clicks on the shoes category page, viewing all of the shoes on your site. She spends 20s here.
- Jan 1, 8:07pm: Jane clicks on a pair of shoes and spends 90s here. She expands the sizing section.
- Jan 3, 7:22pm: Jane returns to your site from her laptop and again views the shoe category page. She clicks on the same pair of shoes.
- Jan 3, 7:23pm: Jane adds the shoes to her cart and checks out.
- Jan 4, 9:57am: Jane checks her order status from her phone.
A full-journey tool links all of these touches to one unique ID, meaning that you can see all the actions that Jane took across different devices up until the moment she purchased. This kind of journey is impossible with most tools, including Google Analytics. It would just look like a few disjointed sessions from different users and you’d completely miss out on how important it was for Jane to see related products. You can, however, get this kind of data with no configuration or setup using AnalyticsWP.
How to capture full WooCommerce customer journeys
So, how do we set up AnalyticsWP to get user journey data as described above? It’s a little anticlimactic. You just… install it. You can set up custom events so you can see things like interactions with custom elements on your site, but by default and without any setup, AnalyticsWP will completely integrate with WooCommerce and combine all of your user journey data. AnalyticsWP is the best WordPress analytics plugin that integrates automatically and deeply with WooCommerce. It uses first-party tracking, which means it records every interaction directly on your own server. This approach prevents it from being blocked by ad-blockers and makes it easier to comply with privacy regulations. 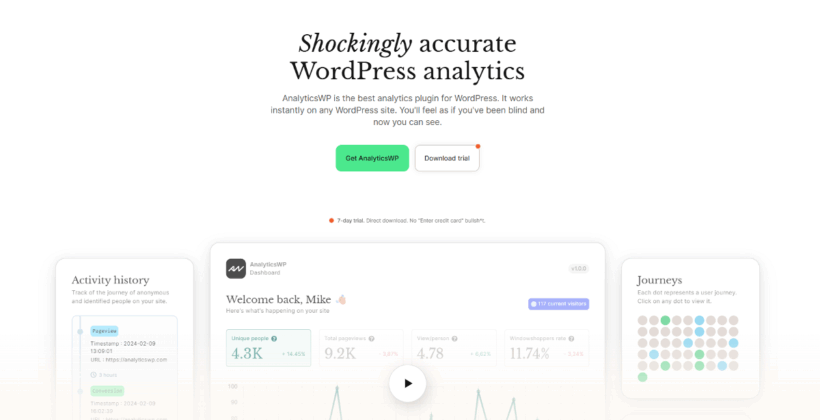
- Filter the specific traffic that came from just Google or YouTube.
- Filter all traffic that went to the pricing page
- Filter all traffic that went to the pricing page, that came from Facebook ads specifically.
- Any of the above, but cleaning the data further, i.e., users only on desktop or mobile.
Journeys: view the entire customer journey
Unlike traditional analytics tools that show numbers, AnalyticsWP comes with a "Journeys" feature. This feature helps you clearly see the full path a visitor takes on your site. It's like getting a complete visual timeline of their experience. You can find this feature by navigating to AnalyticsWP → Journeys in your WordPress admin. On this page, you'll see small circles, each representing a unique user journey. 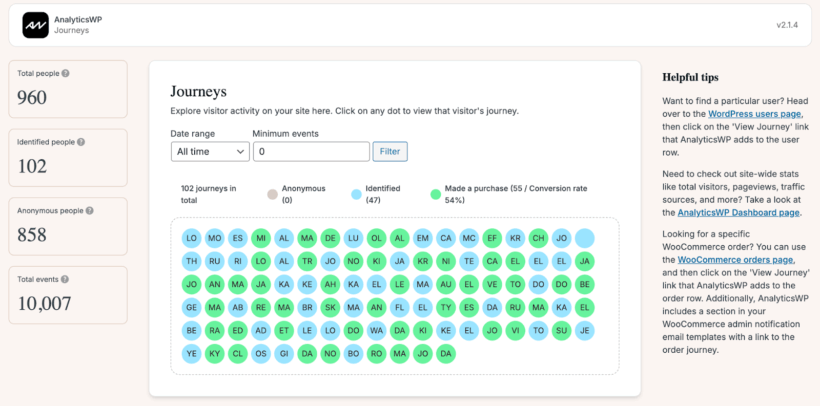
- Anonymous journeys: These show visitors who browse your site without being logged in.
- Identified journeys: This category includes users who have logged into your site. AnalyticsWP can even merge events for the same user across different devices.
- Conversion journeys: These specifically highlight users who completed a goal you've set up, such as completing an order in your WooCommerce store.
As an example, let's look at a complete user journey in the AnalyticsWP interface:
It shows a list of all the pages users visited and actions they took. Each entry provides details like the timestamp, referrer, page URL, and device. You can also see the time between events, helping you understand the user's pace. When any conversion or custom event takes place, they are highlighted with a different color to make it easy to spot at a glance. All journeys are initially shown as “Anonymous.” They become "Identified” once the user logs in or places an order. You also get helpful filtering options. These let you easily focus on specific timeframes or activities, which is great if you want to focus your analysis on more active visitors or a specific subset of your users. Want to see the journey for a specific customer who placed an order? AnalyticsWP adds a "View Journey" button right next to each WooCommerce order, and clicking this button takes you to the detailed journey timeline for that customer. 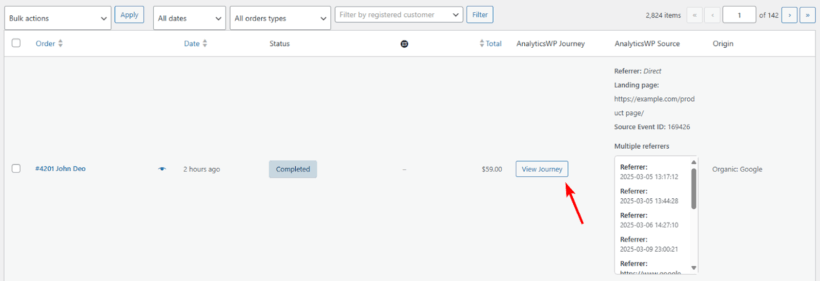
See activity in real-time using live events
Another feature that lets you see how customers interact on your website in real-time is Live Events. You can find this feature by navigating to AnalyticsWP → Live Events in your WordPress dashboard. This page gives you a look at what visitors are doing on your site in real time. This is perfect when you want to see visitor activity live and get instant feedback. For example, if you're running a limited-time sale, launching a new product, or testing changes on a key page, you can immediately see how visitors are reacting to that. 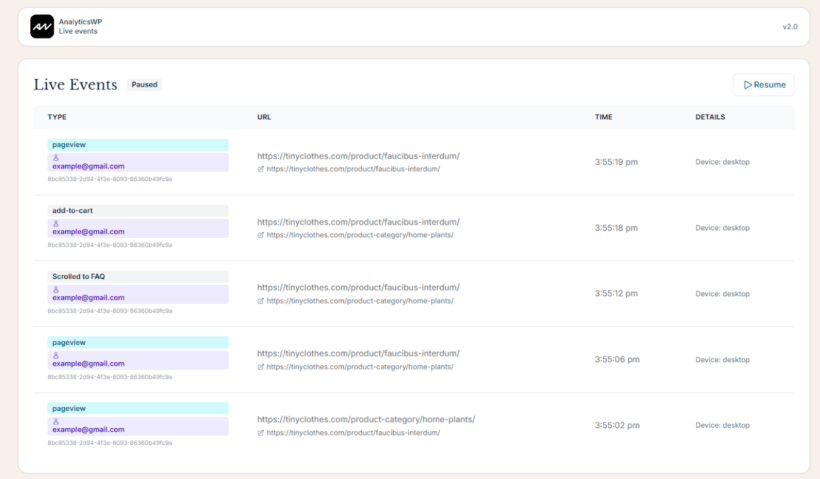
How to add custom events for more enhanced tracking
Out of the box, AnalyticsWP automatically tracks key WooCommerce conversion events. But to truly understand the customer journey, you'll often want to see the specific actions visitors take before they make a purchase. This is where custom events come in. They allow you to track important interactions on your site, giving you a much clearer picture of the path to conversion. AnalyticsWP makes adding custom events easy, especially if you're using popular page builders. It offers direct integrations with:
- Breakdance
- Oxygen
- Elementor
- Divi
- Bricks
AnalyticsWP.event('event-action-name');. Let’s look at an example using custom events on single product page built using Breakdance. Start tracking complete WooCommerce customer journey
Getting a clear picture of how customers move through your WooCommerce store can feel like a puzzle with the tools we’ve all been forced to use for years. Traditional analytics tools make it tough to truly understand customer behavior and know exactly where to focus your efforts for growth. Such tools don’t provide a complete journey view of everything a customer does on your site. AnalyticsWP captures and visualizes the entire customer path through its Journeys feature. It integrates with WooCommerce, supports custom events, and runs entirely inside the WordPress dashboard, providing a detailed view of every interaction. A real-time events stream and flexible filters make it easier to examine traffic and behavior in depth.